First Seen
2023-12-18T06:50:07+00:00
simple-description (qwen3.5_2b-q8_0)
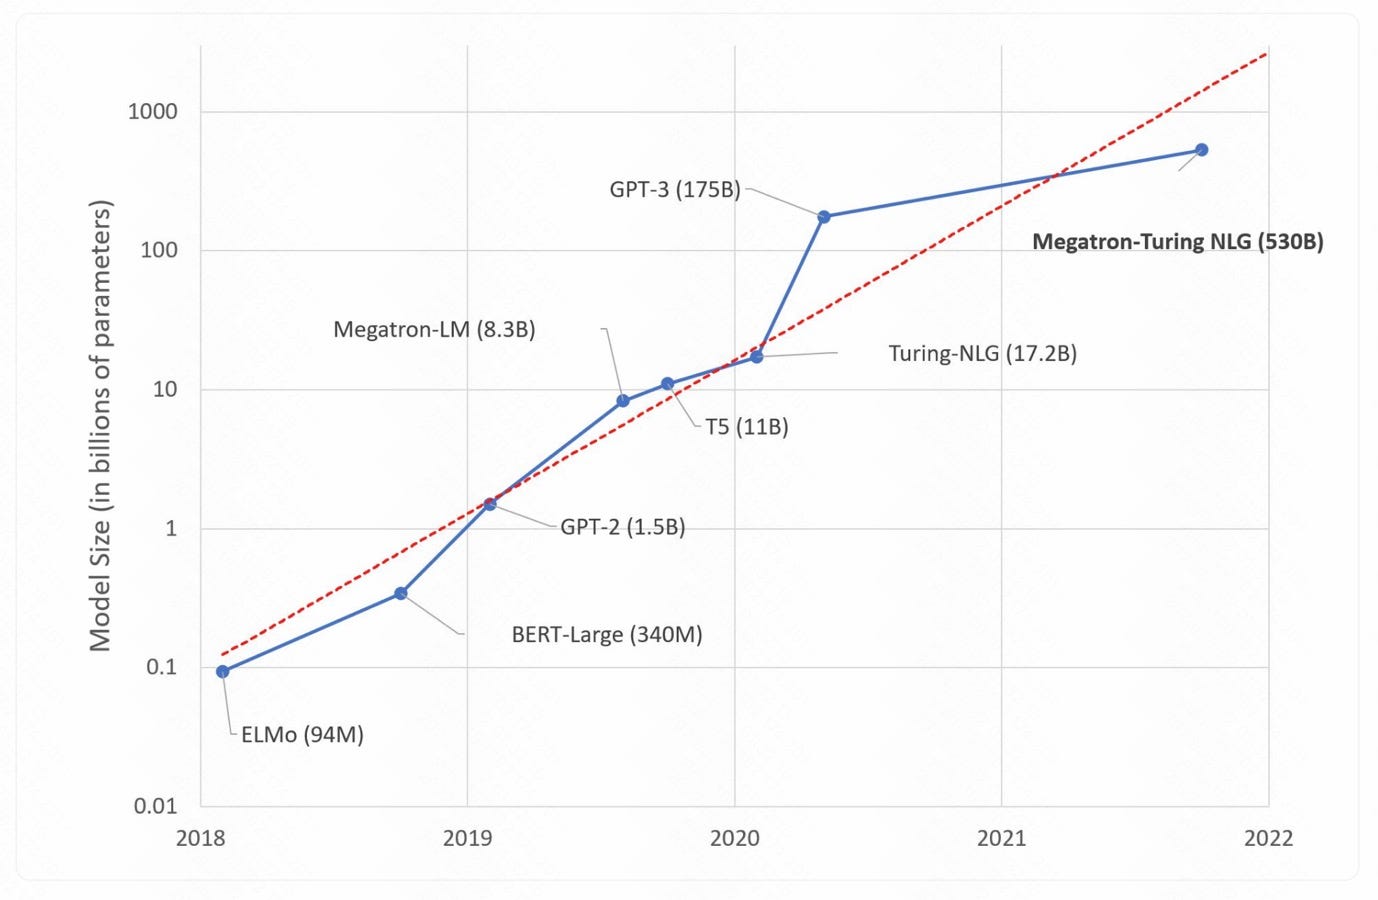
This graph illustrates the rapid "explosive growth" of AI technology, specifically focusing on the scale of parameters in different large language models. It contrasts the massive jump in model size seen in 2021 (GPT-3 at 175 billion parameters) with the even larger Megatron-Turing NLG model by 2022 (530 billion parameters). The red dashed line appears to suggest a much slower, linear growth trend, humorously implying that future models could potentially be smaller again or grow more steadily, contrasting with the reality of the recent AI boom.
simple-description (llama3.2-vision_11b)
The meme is a humorous image that pokes fun at the rapid growth of artificial intelligence (AI) and its ability to generate content. The image likely shows a graph or chart with a steeply rising curve, illustrating the exponential growth of AI models in recent years. The text accompanying the image might read, "AI is getting smarter, faster, and more capable... just like me!"
detailed-analysis (gemma3-27b-vision)
Okay, let's break down this graph using the requested theoretical frameworks. It's a rich visual and lends itself to several interpretations.
Visual Description
The image presents a line graph tracking the increasing size of large language models (LLMs) in terms of parameters (measured in billions). The Y-axis is on a logarithmic scale, demonstrating exponential growth. The X-axis represents time, spanning from 2018 to 2022. Several models are plotted as lines, each labeled with its name and the number of parameters it comprises (e.g., GPT-3 (175B)).
Key observations:
- Exponential Growth: The most striking feature is the clear exponential increase in model size over the period. What starts at fractions of a billion parameters in 2018 climbs to hundreds of billions by 2022.
- Model Competition: Multiple models are tracked, suggesting competition in this space. Models initially start close together, but diverge as development progresses. GPT-3 (plotted in blue) maintained a lead for a time, but has been surpassed by Megatron-NLG.
- Logarithmic Scale: The log scale dramatically emphasizes the growth. A linear scale would make the earlier part of the graph almost flat, masking the early advances.
- Labeling: Labels clearly identify each model and their parameter size at the endpoint of their respective lines.
Foucaultian Genealogical Discourse Analysis
This graph demands a Foucaultian analysis. Rather than focusing on "progress," we need to ask how this discourse of "bigger is better" in language model size has come to be normalized and how it shapes what is considered "knowledge" and "intelligence".
- Power/Knowledge: The graph visually embodies the production of power/knowledge. The exponential increase isn't a natural outcome of technological necessity. It’s a result of specific power dynamics – investment, research priorities, competitive pressures, and a belief system that equates scale with improved capability. The graph shows the materialization of this power/knowledge.
- Disciplinary Regime: The pursuit of ever-larger models can be seen as a form of technological disciplining. The "metric" of parameter count becomes a standard for evaluation, shaping the research agenda. Those who adhere to this standard receive funding, recognition, and visibility.
- Archaeology of the Concept: Tracing the historical emergence of “large language models” reveals an archaeology of shifting concepts of intelligence. The focus shifted from models mimicking human abilities to building models that have computational abilities. The graph visualizes the shift and emphasizes the changing notion of what constitutes intelligence.
- Genealogy of Model Size: The belief that increasing model size is intrinsically good isn’t a given. It’s a historical contingency. The graph invites us to ask why this particular metric became dominant. What other metrics were discarded or marginalized? What were the initial conditions that enabled this trajectory?
Critical Theory (Frankfurt School)
This graph can be examined through the lens of Critical Theory, focusing on the ways in which technology reinforces systems of domination.
- Instrumental Reason: The relentless pursuit of scaling models epitomizes “instrumental reason” (Horkheimer and Adorno). The goal isn't necessarily to understand language or create genuinely intelligent systems, but to achieve technical superiority and optimize performance as defined by quantitative metrics.
- Colonization of the Symbolic: The graph depicts the "colonization" of language itself. As LLMs become increasingly sophisticated, they begin to mediate our interactions with information and knowledge. This potentially leads to a homogenization of thought and a suppression of alternative perspectives.
- Reification: The reduction of language model performance to a single metric – parameter count – constitutes a form of reification. It transforms a complex phenomenon (language, intelligence) into a quantifiable variable, obscuring its qualitative aspects.
- Technological Determinism: The graph appears to suggest a trajectory of inevitable progress. However, a critical perspective asks: who benefits from this trajectory? Are there alternative paths of development that prioritize sustainability, accessibility, and ethical considerations?
Marxist Conflict Theory
From a Marxist perspective, the graph highlights the inherent conflicts and power dynamics within the field of AI development.
- Means of Production: The development of these large language models requires massive computational resources, data, and capital. These are concentrated in the hands of a few powerful corporations (Google, OpenAI, Microsoft, etc.). This creates a clear imbalance of power.
- Class Struggle: The pursuit of scaling models can be seen as a form of “class struggle” between different actors: the corporations vying for dominance, the researchers competing for funding, and the users who are increasingly reliant on these technologies.
- Exploitation of Labor & Data: The training of these models requires vast amounts of data, often collected from users without adequate consent or compensation. This can be seen as a form of exploitation of digital labor.
- Concentration of Capital: The graph demonstrates how AI development is increasingly dominated by large corporations with the resources to invest in ever-larger models. This reinforces existing inequalities and creates barriers to entry for smaller players.
Postmodernism
A postmodern reading of this graph challenges the notion of a unified, linear trajectory of technological progress.
- Deconstruction: The graph can be "deconstructed" by questioning the underlying assumptions and categories that shape our understanding of "intelligence" and "language." What does it mean for a machine to "understand" language? Is parameter count a meaningful metric of intelligence?
- Simulacra and Simulation: LLMs can be seen as creating "simulacra" of language – representations that are increasingly detached from their referents. The model simulates understanding, but lacks genuine comprehension.
- Fragmentation & Relativism: The presence of multiple models competing with each other suggests a fragmented landscape rather than a unified pursuit of a singular goal. The "best" model is contingent on specific use cases and evaluation metrics.
- Rejection of Meta-Narratives: The graph challenges the "meta-narrative" of technological progress. There is no guarantee that scaling models will lead to desirable outcomes.
Queer Feminist Intersectional Analysis
This is the most nuanced lens. While less immediately apparent, it's profoundly relevant.
- Bias & Representation: The data used to train these models is inevitably biased, reflecting existing social inequalities. The graph is a visual representation of these biases being scaled up. These biases can manifest in discriminatory outputs. The intersectional dimension is critical here: biases disproportionately affect marginalized groups, reinforcing systemic inequalities.
- Labor & Data Extraction: The data collection process often relies on the unpaid labor of marginalized communities, who contribute to datasets without adequate recognition or compensation.
- Power Dynamics & Control: The control of these technologies is concentrated in the hands of a privileged few, reinforcing existing power imbalances. This can lead to the erasure of marginalized voices and perspectives.
- Non-Linearity & Complexity: Queer and feminist thought reject linear narratives of progress. The increasing size of these models doesn't automatically equate to more inclusive or equitable outcomes. In fact, it can exacerbate existing inequalities. Intersectional analysis acknowledges the complexities and contradictions inherent in technological development.
In conclusion, this seemingly simple graph is a rich site for theoretical analysis. It’s not just about technological progress; it’s about power, knowledge, ideology, and the complex interplay of social forces that shape our world. Each theoretical lens offers a unique perspective, revealing different dimensions of this phenomenon.
tesseract-ocr
1000 ot 28 aa _ GPT-3 (175B) ~_ wg nw ~ =" 2 % #100 get Megatron-Turing NLG (530B) E ge S ae &. Megatron-LM (8.3B) A ee %s \ 2g —_— Turing-NLG (17.2B) ) 10 \ on < a. 2 Zi" “75 (118) 3 ee = @ 1 otf ~GPT-2 (1.5B) oO a” = es “__ BERT-Large (340M) 01 © \ “ELMo (94M) 0.01 2018 2019 2020 2021 2022
simple-description (llama3.2-vision)
The meme is a humorous image of a graph showing the growth of various AI models' computational requirements over time. The graph starts with a small AI model called "ELMo" in 2018, which requires 94 million parameters. The line then jumps to "ELMo" in 2019, which requires 1.3 billion parameters, and continues to increase, reaching 1.3 trillion parameters by 2022.