First Seen
2024-05-04T09:00:51+00:00
simple-description (qwen3.5_2b-q8_0)
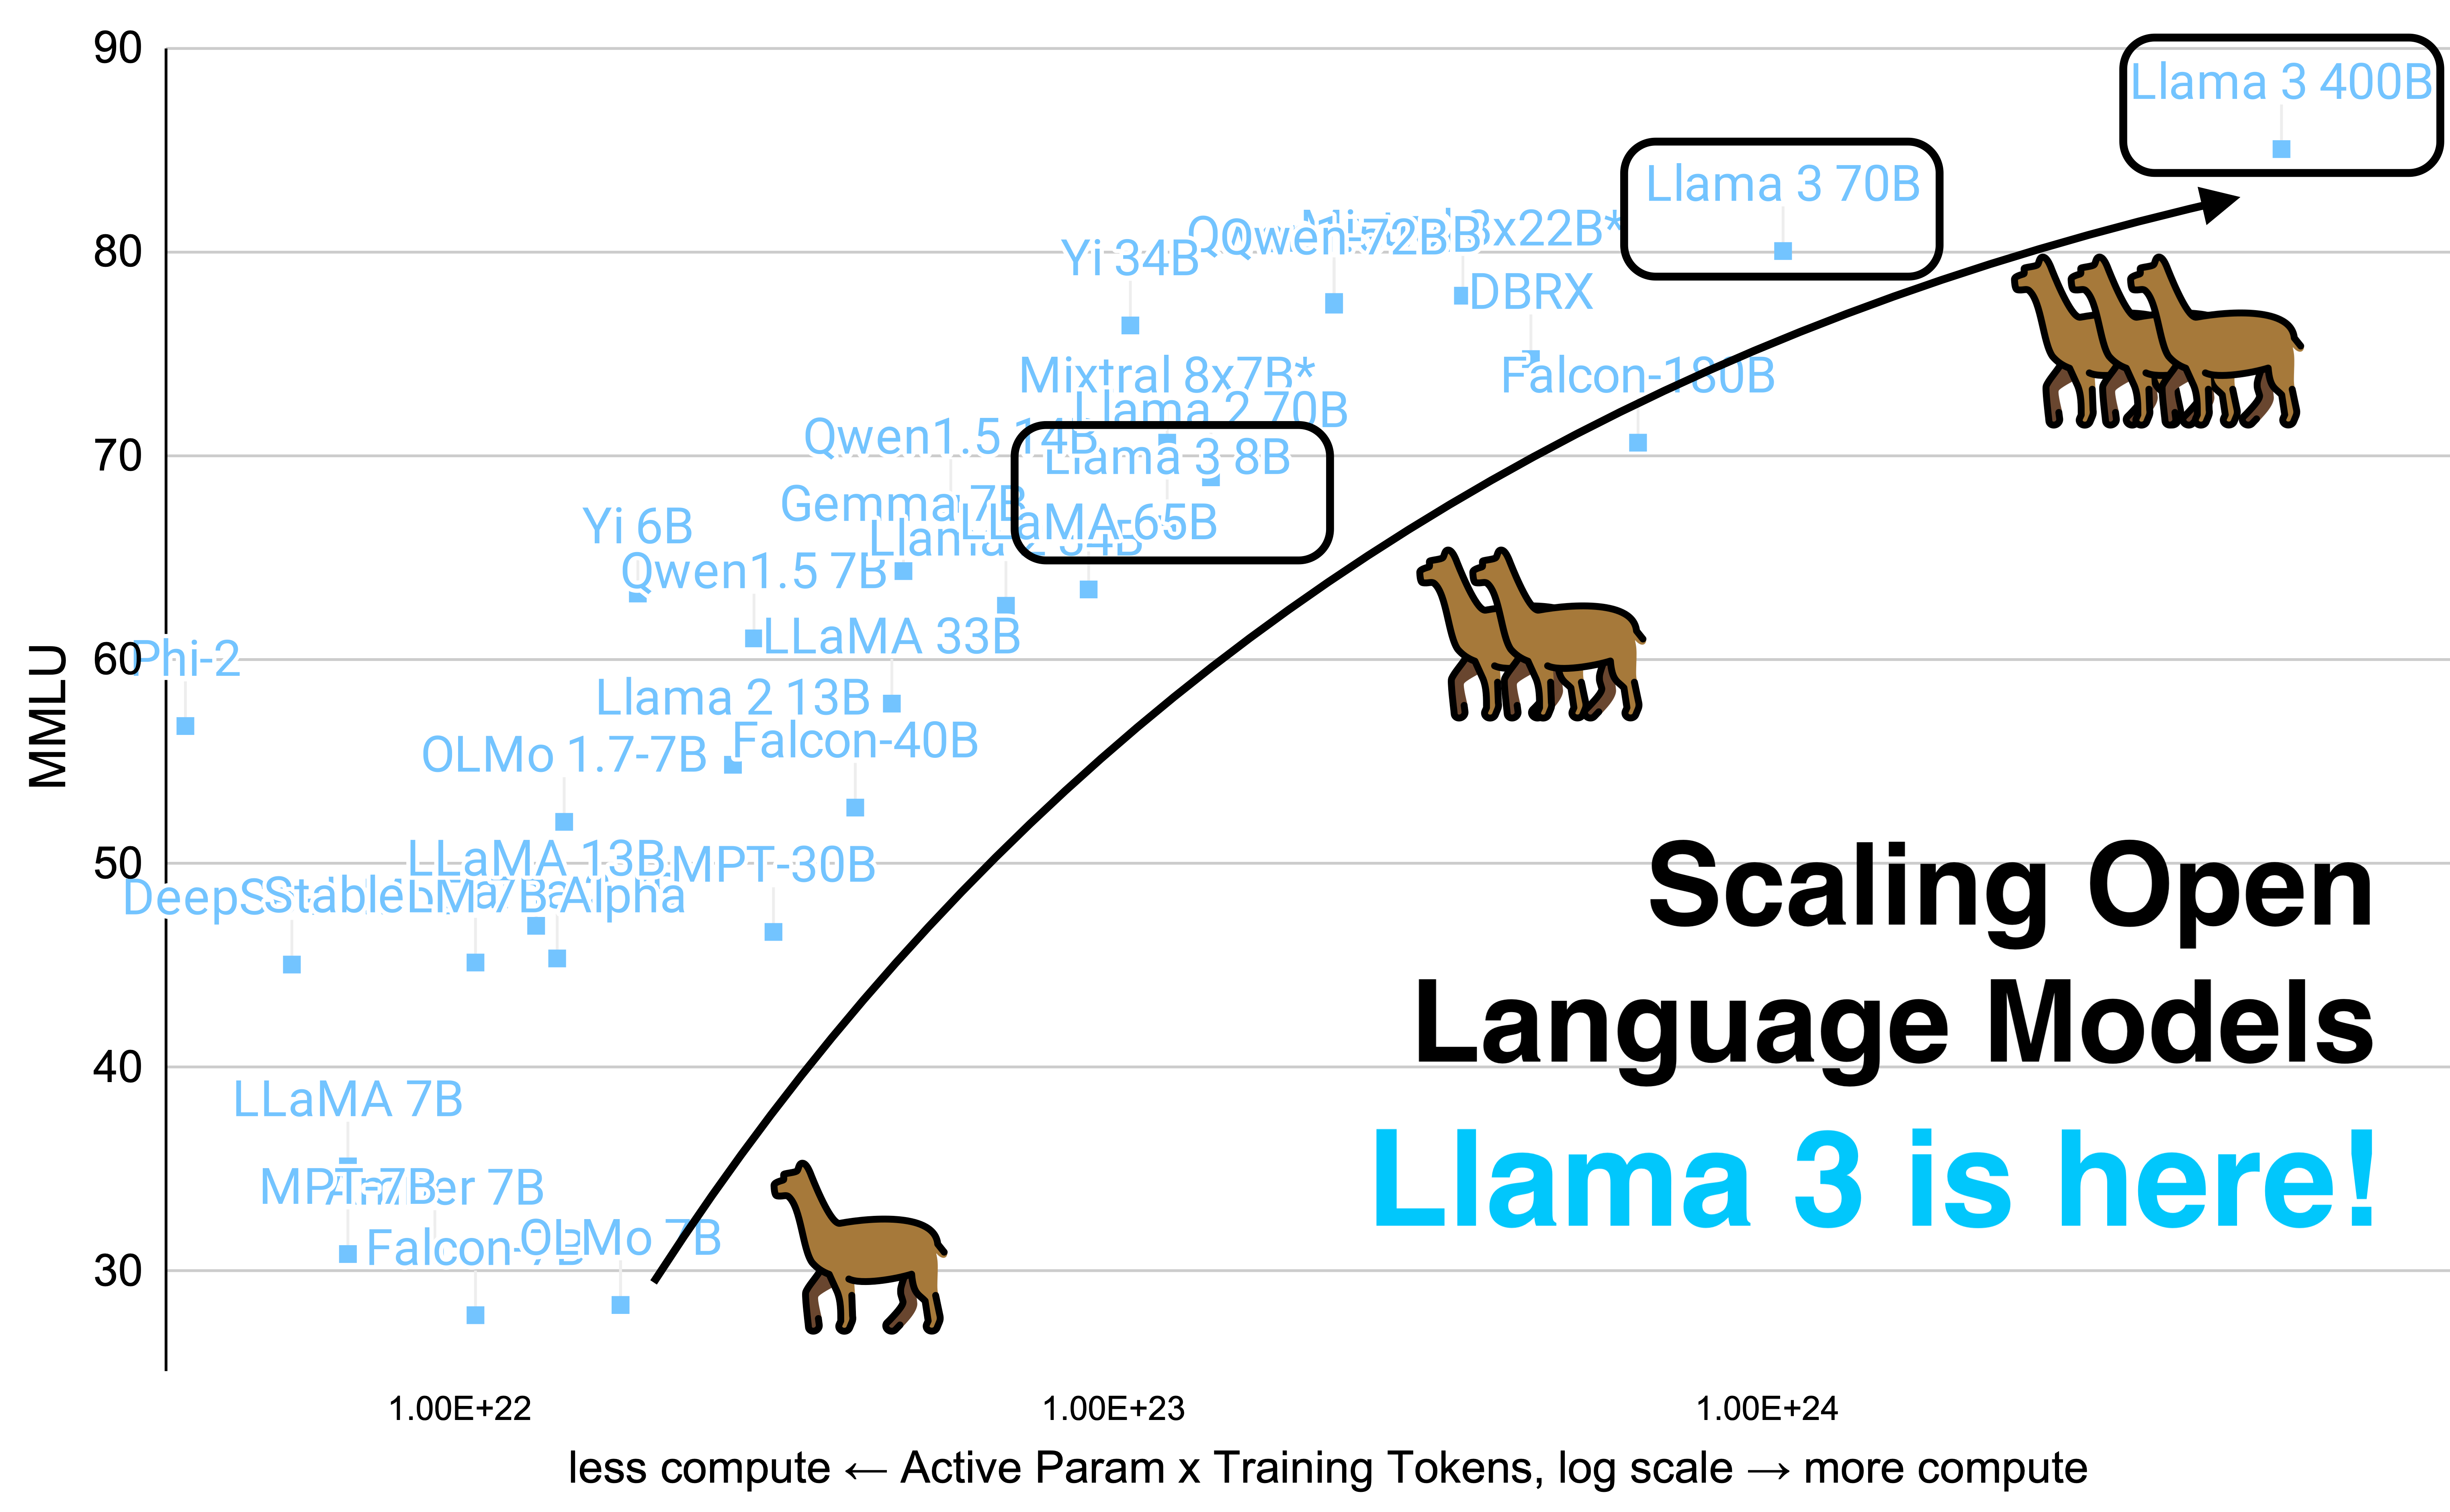
This AI meme illustrates the "Scaling Law," a theory that states models become smarter simply by getting bigger and trained for longer periods. The chart visualizes this trend with a curve of intelligence scores, showing models labeled with llama icons climbing higher as they gain more computational power. The humor comes from the text at the bottom, "Llama 3 is here!" which sarcastically implies that the actual model pictured is the much smaller "Llama 3 8B," rather than the massive version labeled "Llama 3 400B."
simple-description (llama3.2-vision_11b)
The meme is a humorous image of a llama with a speech bubble saying "I can explain AI like I'm explaining a llama to a llama." The image is likely a reference to the concept of explaining complex technical topics in a simple way, using a metaphor of a llama explaining a complex topic to another llama.
detailed-analysis (gemma3-27b-vision)
Okay, here's an analysis of the provided image, broken down into sections as requested. It's a challenging task to apply complex theoretical frameworks to a graph about AI models, so I will do my best to provide insightful interpretations where appropriate, while acknowledging the limits of doing so.
Visual Description
The image is a scatterplot comparing the performance (measured as MMLU score on the y-axis) of various open language models against their computational cost (measured as Active Param x Training Tokens, log scale on the x-axis). The chart appears to illustrate a positive correlation between computational cost and performance.
- Data Points: Numerous data points, each labelled with the name and size (in Billions of parameters - 'B') of a specific language model, are plotted on the graph. These include models like "Llama", "Yi", "Falcon", "MPT", "OLMo", "Gemma", "Mixtral", and "DBRX".
- Trend Line: A purple line tracks the progression of the Llama family of models (Llama 7B, Llama 13B, Llama 33B, Llama 70B, and Llama 3 70B and 8B) demonstrating increasing performance with increasing computational resources.
- Imagery: Scattered across the top of the graph are illustrations of camels. These seem to serve no immediately functional purpose within the data itself, and appear purely as a stylistic element, possibly a branding or meme association.
- Text: The text "Scaling Open Language Models" and "Llama 3 is here!" are prominently displayed, advertising the advancement and introduction of the Llama 3 model.
Foucauldian Genealogical Discourse Analysis
Foucault's genealogical method examines how knowledge and power are intertwined, tracing the historical emergence of concepts and their relationship to power dynamics. Applying this to the image:
- Discursive Formation of "Intelligence": The graph constructs a discourse around "intelligence" as measurable by MMLU. MMLU, as a standardized test, is not an inherent truth but a particular way of defining and valuing cognitive ability. It's a localized, historical artifact of a specific academic/technological project. This creates a specific type of "knowledge" about AI that is tied to the power to define and assess it.
- Power/Knowledge in AI Evaluation: The act of charting these models' performance reinforces a specific power relationship. Those who create the MMLU test, and those who can afford the computational resources to train large models, wield power in shaping the narrative around AI "progress". The graph normalizes this particular form of evaluation.
- Tracing the History of Scale: The very trajectory of the graph, showing an increasing emphasis on larger models ("scaling") reflects a historical shift in the AI field. There was a prior emphasis on different techniques and approaches; the current emphasis on size represents a particular historical contingency, not a necessary path.
- The camels as a disruption: The inclusion of camels is interesting. They disrupt the objective appearance of the chart. Perhaps they represent a symbolic association, playing on the idea of "humps" of data, or are just an attempt to brand or meme this advancement.
Critical Theory
Critical Theory, rooted in the Frankfurt School, examines how power structures are embedded in social and cultural phenomena.
- Technology as Ideology: The graph can be seen as presenting a technologically deterministic view of AI development. It implies that simply increasing scale will lead to improvements in performance, potentially obscuring the underlying social, ethical, and political considerations that also shape AI development. This supports a neoliberal narrative that more computing power is equivalent to more advancement.
- The Illusion of Objectivity: While presented as a scientific comparison, the MMLU score itself is a constructed metric. It doesn't capture the full complexity of intelligence or the potential harms that AI systems can pose. The graph thus projects an illusion of objective measurement, masking the value judgments embedded within the evaluation process.
- Commodification of Intelligence: The constant drive to improve MMLU scores can be seen as part of a broader project of commodifying intelligence. AI systems are being developed not necessarily to solve social problems, but to generate profit, and performance metrics like MMLU serve as a proxy for market value.
- The Camels and the Absurd: The camels can be seen as an indication of the absurdity of the whole process. A graphic about the advancement of AI with camels littered on top appears incongruous, perhaps to highlight how far removed this technical advancement is from the actual everyday lives of humans.
Marxist Conflict Theory
Applying a Marxist lens, we can see conflict inherent in the development and representation of AI.
- Capital and the Means of Computation: The graph inherently favors those with access to capital. Training large language models requires massive computational resources, which are controlled by a relatively small number of corporations. This reinforces existing inequalities in the distribution of power and wealth.
- The Exploitation of Data: The training of these models relies on vast datasets of text and code, much of which is created by unpaid or underpaid laborers. This data can be seen as a form of "cognitive labor" that is exploited to create value for the owners of these AI systems.
- Class Struggle in AI: As AI systems become more powerful, they may exacerbate existing class inequalities by automating jobs and concentrating wealth in the hands of those who control the technology. The graph, by celebrating the "scaling" of these systems, can be seen as implicitly legitimizing this process.
- The Camels as Symbols of Labour: The camels, historically used as beasts of burden and symbols of laborious work, may be a subconscious metaphor for the human labor that underpins the entire system.
Postmodernism
Postmodern thought challenges grand narratives and emphasizes the subjective and fragmented nature of knowledge.
- Deconstructing "Intelligence": Postmodernism would question the very idea of "intelligence" as a fixed or objective concept. The MMLU score is a culturally specific metric that reflects particular values and biases. It doesn’t represent any universal standard.
- The Instability of Meaning: The graph, while seemingly straightforward, is subject to multiple interpretations. The meaning of the data points, the trend lines, and even the camels are all open to interpretation.
- The Simulation of Truth: The graph creates the illusion of objective truth, but it is ultimately a constructed representation of reality. The emphasis on quantifiable metrics obscures the complex social, ethical, and political considerations that shape AI development.
- The Camels as Pastiche: The inclusion of camels can be seen as a form of pastiche or playful appropriation, disrupting the seriousness of the scientific presentation.
Queer Feminist Intersectional Analysis
Applying a queer feminist intersectional lens, we must consider how power operates along multiple axes of difference.
- Bias in Datasets: The datasets used to train these models likely contain biases reflecting existing societal inequalities related to gender, race, sexuality, and other marginalized identities. These biases can be amplified by the models, leading to discriminatory outcomes.
- Lack of Diversity in AI Development: The field of AI is dominated by a relatively small number of privileged groups, leading to a lack of diverse perspectives in the design and development of these systems. This can perpetuate existing power imbalances and exclude marginalized voices.
- The Camels and Colonial History: The use of camels, historically associated with colonial exploitation and trade routes, may be problematic. It can be interpreted as a subtle reinforcement of colonial power dynamics and the erasure of marginalized histories.
- The “Scaling” Narrative and Exclusion: The emphasis on "scaling" can be seen as a form of technological solutionism that ignores the social and political factors that contribute to inequality. This can lead to the exclusion of marginalized communities from the benefits of AI development.
Disclaimer: These interpretations are speculative and open to debate. The application of complex theoretical frameworks to a seemingly simple graph can be challenging, and there are always multiple ways to interpret the data.
tesseract-ocr
conor Llama 3 70B - 80 _o jpQQwent72BB)x | Yi io | .DBRX - Mixtral 8x78 Falcon; GemmayAl | Yi 6B VOaMAc65B Qwent1.5 760 ate = Llama 213Be = | OLMo 1.7-7B falcon-40B g a o = kLaMA13B:MPT-30B - hb cepsStablebve/ Bealpna | Scalli ng Open o Language Models LLaMA 7B : MP =7Ber 7B _Liama 3 IS nere! 3p » Falcon-QEMo gO || 1.00E+22 1.00E+23 1.00E+24 less compute < Active Param x Training Tokens, log scale — more compute
simple-description (llama3.2-vision)
The meme is a humorous image that shows a graph of the size of popular AI models, with the largest model, Llama 3, at the top right. The text "Llama 3 is here!" is written in bold, playful font, implying that the new model is finally available. The image is likely meant to be humorous and lighthearted, poking fun at the idea that a new AI model is finally available.