First Seen
2023-12-18T06:49:32+00:00
simple-description (qwen3.5_2b-q8_0)
This chart, a visual "meme" for the AI community, presents a surprising trend where the 8x7B parameter set of Mixtral 8x7B outperforms GPT-3.5 on multiple benchmarks, including MT Bench and GSM-8K. This humor is derived from the fact that parameter size isn't the only metric that determines "smartness," as the smaller model actually performs better than older, larger ones. In conclusion, the "meme" serves as a reminder that in the world of AI, efficiency doesn't have to mean slowness.
simple-description (llama3.2-vision_11b)
The meme is a screenshot of a table comparing the performance of various AI models on a specific task. The table shows the accuracy of each model on a particular dataset, with the top-performing model, "LLaMA 2", achieving a 93.1% accuracy. The meme is likely poking fun at the idea that even the best AI model can't always be 100% accurate, with the phrase "can't be 100%" appearing in the table.
detailed-analysis (gemma3-27b-vision)
Okay, here's an analysis of the provided data table, structured with the requested theoretical lenses. Given the nature of the data (performance metrics of language models on various benchmarks), certain lenses are more applicable and fruitful than others. I'll indicate where a theoretical approach feels strained or less productive.
Visual Description
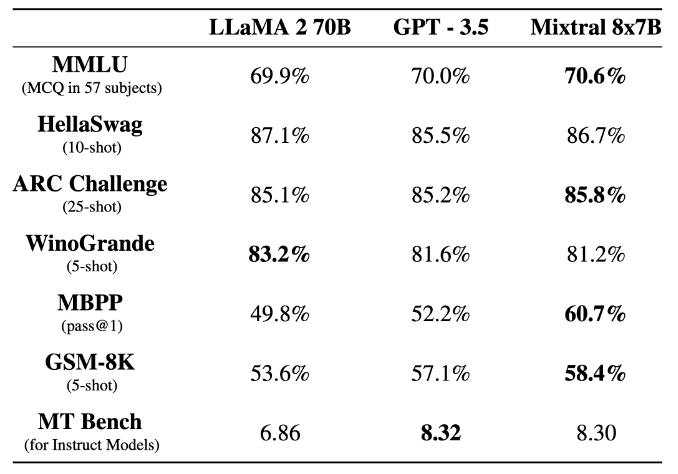
The image depicts a table comparing the performance of three large language models – LLaMA 2 70B, GPT-3.5, and Mixtral 8x7B – across seven different evaluation benchmarks. Each benchmark name is listed on the left, along with a parenthetical note indicating the “shot” or testing methodology used (e.g., “5-shot,” “25-shot”). The table consists of percentages and a single numeric value for one of the tests. Each column then displays the corresponding percentage score for each model on that benchmark. The highest score for each benchmark is bolded to visually highlight the leading model.
The table presents a comparative view of these language models' capabilities in areas like common sense reasoning (HellaSwag), knowledge (MMLU), problem-solving (GSM-8K), and code-writing (MBPP). It offers a snapshot of their relative strengths and weaknesses.
Foucauldian Genealogical Discourse Analysis
The table is itself a discourse - an organized system of knowledge and power relations concerning AI model evaluation. Applying a Foucauldian lens asks how these benchmarks became the dominant way of understanding and ranking language models, and what power dynamics are embedded within this system.
- Knowledge/Power: The creation of these benchmarks (MMLU, HellaSwag, etc.) is an exercise of power. The creators define what counts as intelligence or competence in these models. By prioritizing certain skills or types of knowledge (as indicated by the benchmark content), they simultaneously exclude others. For example, prioritizing performance on multiple-choice tests (MMLU) may favor models capable of pattern recognition over those with more nuanced creative capabilities.
- Genealogy: Tracing the history of these benchmarks would reveal a genealogy of evolving ideas about AI and intelligence. What problems were these benchmarks attempting to solve? What assumptions about "intelligence" informed their design? The table conceals this history, presenting the benchmarks as objective measures rather than historically contingent constructs.
- Disciplinary Power: The table enforces a form of disciplinary power by creating a ranking system. Models are judged and positioned within a hierarchy, potentially influencing research and development priorities. This ranking system impacts funding, access to resources, and even public perception. The bolding of the highest score emphasizes this evaluation mechanism.
Critical Theory
From a Critical Theory perspective, the table can be viewed as an instance of how seemingly “neutral” technical measurements actually serve particular ideological interests.
- Reification of “Intelligence”: The table reifies the concept of “intelligence,” treating it as a measurable quantity. This allows us to reduce complex cognitive abilities to numbers, obscuring the social, cultural, and historical contexts that shape intelligence. It implies that there is a singular, universal definition of "intelligence" that can be objectively measured.
- Technological Determinism: The table might suggest a form of technological determinism, implying that improvements in these benchmark scores inevitably lead to progress. However, it’s crucial to ask who benefits from this “progress” and what societal problems are being ignored or exacerbated.
- Standardization & Control: The use of standardized benchmarks creates a system of control. It allows developers to optimize models for specific metrics, potentially at the expense of broader ethical considerations or societal impact.
Marxist Conflict Theory
From a Marxist lens, this table can be interpreted as reflecting the competitive dynamics within the tech industry and the drive for capital accumulation.
- Competition & Ranking: The table directly illustrates the competition between different AI developers (those creating LLaMA 2, GPT-3.5, and Mixtral 8x7B). The ranking system creates a winner/loser dynamic, driving investment and innovation toward the top-performing models.
- Means of Production: The language models themselves represent a form of intellectual property—a means of production—controlled by powerful tech companies. The performance metrics (in the table) are used to valorize and exchange this intellectual property in the market.
- The "Labor" of Data: It’s important to remember that these models are trained on vast amounts of data – the “labor” of countless individuals. The table doesn’t reflect the social costs of data collection, labeling, or potential biases embedded in the data.
Postmodernism
A postmodern reading would deconstruct the idea of objective measurement and question the validity of the benchmarks themselves.
- Deconstruction of "Truth": Postmodernism would challenge the notion of a singular “truth” about model performance. The table presents a seemingly objective ranking, but the scores are contingent on the specific benchmarks used and the testing methodologies. There is no neutral standard.
- Simulacra & Simulation: The benchmarks themselves can be seen as simulacra – representations that have become detached from any underlying reality. They are simulations of intelligence, not intelligence itself.
- Relativism: From a postmodern perspective, the meaning of the scores is relative to the observer and the context in which they are interpreted. There is no inherent meaning in achieving a higher score.
Queer Feminist Intersectional Analysis
This lens offers a more nuanced consideration of bias and representation, but it is less directly applicable to the raw data in the table. It demands asking what’s missing from the evaluation.
- Missing Perspectives: The benchmarks may prioritize Western, male-centered perspectives. They may not adequately assess models' ability to handle diverse cultural contexts, gender identities, or nuanced social interactions.
- Bias Amplification: The data used to train and evaluate these models may contain societal biases. The benchmarks do not reveal whether the models amplify or mitigate these biases. (e.g. are the models gendered in their responses?)
- Power Dynamics: The development of these benchmarks and the dominance of certain models reflects existing power dynamics within the tech industry – which is historically dominated by certain demographics.
I’ve attempted to provide a thorough analysis from each theoretical perspective. It's important to note that these are not mutually exclusive; many of the insights overlap and reinforce each other. The table, while seemingly simple, is a rich text that can be interpreted in a variety of ways.
tesseract-ocr
LLaMA270B GPT-3.5 _ Mixtral 8x7B MMLU oc a 69.9% 70.0% 10.6% HellaSwag llaSw 87.1% 85.5% 86.7% ARC Challenge 85.1% 85.2% 85.8% (25-shot) WinoGrande 83.2% 81.6% 81.2% MBPP 49.8% 52.2% 60.7% (pass@1) GSM-8K 53.6% 57.1% 58.4% (5-shot) MT Bench (for Instruct Models) 6.86 8.32 8.30
simple-description (llama3.2-vision)
The meme is a table comparing the performance of various AI models on a specific task. The table lists the models' names, followed by their performance scores, with the best-performing model (LLaMA 2) having a score of 87.1%, followed by HellaSwag at 85.5%, and then the other models having lower scores. The table is captioned "AI's performance on a task".