First Seen
2025-06-04T04:31:38.149673+00:00
simple-description (qwen3.5_2b-q8_0)
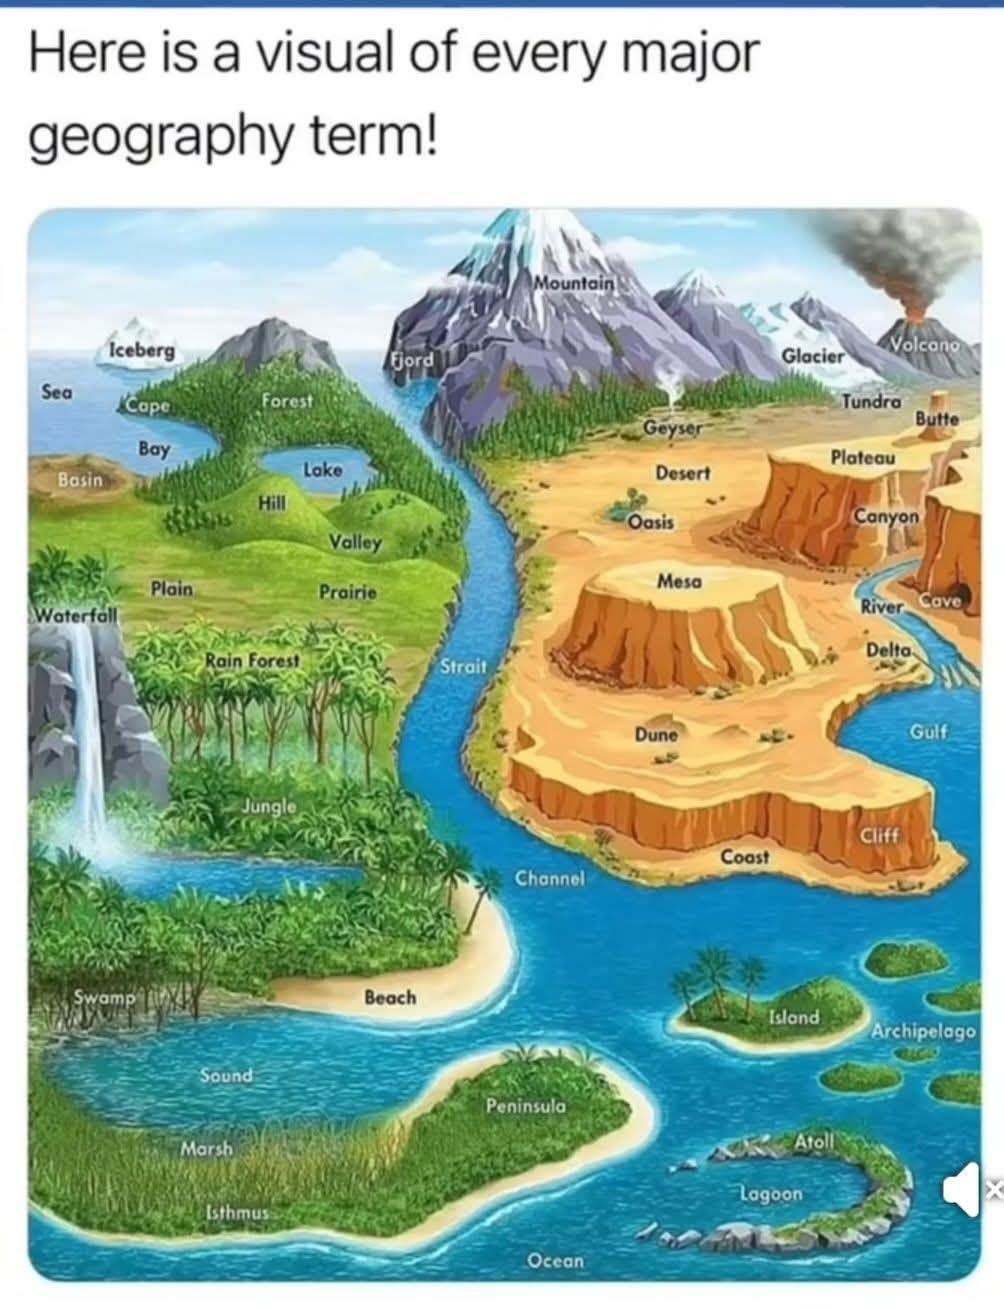
This is a colorful cartoon map designed to teach geography through a visual scene. The text at the top reads, "Here is a visual of every major geography term!" The image depicts a landscape divided between lush green terrain on the left and a dry, desert-like section on the right. Various geographical terms are written across the features, such as "Ocean," "Bay," "Plateau," "Canyon," and "Gulf."
detailed-analysis (gemma3_27b-it-q8_0)
Okay, let's analyze this image – a labeled diagram of various geographical features – through the lenses requested. It’s important to note that applying highly theoretical frameworks to a seemingly straightforward educational image is often a bit of a stretch, and involves interpreting the image through the framework’s core tenets.
Visual Description
The image is a brightly colored, cartoonish illustration depicting a landmass surrounded by water. It’s clearly designed as an educational tool to teach geographical terms. The landform types are labelled and pointed to directly on the illustration. We see a variety of features, including mountains, valleys, deserts, plains, forests, and a multitude of coastal and aquatic elements (bays, gulfs, straits, etc.). The style is somewhat dated – resembling an illustration from a children’s encyclopedia from perhaps the 1980s or 90s. The color palette is vibrant, and the overall composition is meant to be accessible and easy to understand.
Foucauldian Genealogical Discourse Analysis
From a Foucauldian perspective, this image represents a discourse of geographical knowledge. It isn’t simply a neutral representation of the world; it constructs a particular way of understanding and categorizing landscapes.
- Power/Knowledge: The act of labeling and defining these landforms isn't neutral. It establishes a power dynamic. Those who define these categories (geographers, educators, cartographers) wield power by structuring how we perceive and interact with the environment. The categories themselves aren’t "natural" but are historically produced.
- Genealogy: Tracing the history of these terms would reveal how the meaning of "mountain" or "desert" has shifted over time, influenced by changing scientific understandings, cultural perceptions, and colonial projects. (For example, how "desert" was often seen by Europeans as a blank, unproductive space needing "improvement".)
- Disciplinary Power: This image functions as a form of disciplinary power – it teaches a normalized way to classify and organize the world. It creates legible subjects who can correctly identify and name these features, conforming to the established norms of geographical understanding. The image "disciplines" our gaze, shaping how we see the world.
Critical Theory
Critical Theory, stemming from the Frankfurt School, focuses on revealing power structures and challenging dominant ideologies. Here, we can apply it by considering how this image reinforces certain assumptions.
- Rationalization and Domination: The image epitomizes the impulse to "rationalize" nature – to break it down into discrete, manageable categories. This rationalization can be seen as a component of the broader Western project of dominating and controlling nature. By labeling and classifying, we create a sense of mastery over the landscape.
- Instrumental Reason: The image emphasizes what landforms are – their descriptive characteristics – without considering why they matter in terms of social, political, or ecological impact. It fosters an instrumental reason focused on knowledge for control rather than understanding and connection.
- The Illusion of Objectivity: The image presents these landforms as objective facts, when in reality, their significance is always shaped by human values and purposes. The way a "plain" is perceived and utilized differs vastly depending on cultural context (e.g., for agriculture, for nomadism, for conservation).
Marxist Conflict Theory
From a Marxist perspective, this image can be analyzed through the lens of control of resources and production.
- Land as a Means of Production: Geographical features are fundamentally tied to economic activity. Plains support agriculture, mountains contain minerals, coasts facilitate trade. The image, implicitly, highlights the potential for exploitation and resource extraction within these landscapes.
- Uneven Development: The categorization of landscapes can reinforce existing inequalities. Certain landforms might be deemed "valuable" (e.g., resource-rich mountains) and become sites of conflict, while others are marginalized.
- Ideological Function: The seemingly neutral image serves an ideological function, naturalizing the idea of land as a commodity – a resource to be exploited for profit. It doesn’t explicitly address issues of land ownership, access, or the social consequences of resource extraction.
Postmodernism
Postmodernism challenges grand narratives, universal truths, and stable meanings.
- Deconstruction of Categories: A postmodern approach would question the very categories presented in the image. Are "mountains" and "deserts" truly distinct entities, or are these artificial constructs? The boundaries between these categories are often fluid and contested.
- Subjectivity of Perception: Postmodernism would emphasize that perception of a landform is subjective. An "oasis" may be seen as a life-saving haven by a traveler, but an ecological disturbance by an environmentalist.
- The Loss of a "Master Narrative": The image represents a desire to create a comprehensive understanding of geography. Postmodernism would argue that such a “master narrative” is impossible. There is no single, definitive way to map or understand the world.
Queer Feminist Intersectional Analysis
This is the most challenging lens to apply directly, but we can still draw some insights.
- Spatial Politics and Power: Space is not neutral; it’s shaped by power dynamics based on gender, sexuality, race, and class. Certain landscapes might be associated with masculinity (e.g., "conquering" mountains), while others might be seen as inherently "feminine" (e.g., "nurturing" valleys).
- Marginalized Landscapes & Bodies: The image predominantly focuses on large-scale landforms, potentially obscuring the experiences of those who live in smaller, more marginalized spaces (e.g., swamps, marginalized coastal areas). This also parallels the erasure of marginalized bodies.
- Environmental Justice: The distribution of environmental burdens and benefits is often unequal, disproportionately impacting women, people of color, and LGBTQ+ individuals. A critical analysis would ask: Who benefits from the "development" of these landscapes, and who bears the costs?
In conclusion, what appears to be a simple educational image can be unpacked to reveal complex power dynamics, ideological assumptions, and the constructed nature of geographical knowledge. These frameworks allow us to see beyond the surface level and understand how knowledge is always situated, contested, and shaped by social forces.
simple-description (llama3.2-vision_11b)
The meme is a humorous illustration of a map that shows every major geographical feature in a single image, with the caption "Here is a visual of every major geography term!" The image is a sprawling, detailed map that includes various geographical features such as mountains, oceans, deserts, and forests, labeled with their corresponding terms. The text at the top of the image reads "Here is a visual of every major geography term!"
detailed-analysis (gemma3-27b-vision)
Okay, let's break down this illustrated map of geographical terms through a few theoretical lenses. I'll structure this with the headings you requested, omitting those where the connection feels stretched or doesn’t meaningfully apply.
1. Visual Description
The image is a brightly colored, cartoonish illustration designed to visually teach geographical terms. It depicts a composite landmass featuring various landforms, bodies of water, and habitats. A winding river runs from mountainous highlands, past forested areas, through plains and prairies, to eventually empty into the ocean. The illustration labels these features directly with their corresponding terms (e.g., “Mountain,” “Lake,” “Desert”). The aesthetic is one of simplified clarity, suitable for educational purposes, perhaps for children or introductory geography learning. It utilizes a limited color palette, with a focus on blues for water, greens for vegetation, browns for land, and whites for snow-capped peaks and ice. The composition feels somewhat flattened, prioritizing identification of features over realistic depth or scale.
2. Foucauldian Genealogical Discourse Analysis
This image can be examined through a Foucauldian lens as a discursive formation defining and normalizing a particular understanding of geography.
- Power/Knowledge: The illustration exercises power by defining what counts as a geographical term worthy of being labelled and identified. It creates a specific epistemology (way of knowing) about the natural world. What is not represented (subtle topographic nuances, indigenous names for landforms, the impact of human alteration) is equally significant. The image subtly constructs our understanding of 'geography' itself.
- Genealogy: The history of these terms isn’t presented. A genealogical analysis would ask: How did these terms emerge? What social, political, and scientific forces shaped their definition? For example, the term "plain" may have origins in agricultural practices and land ownership, while "fjord" reflects Scandinavian seafaring traditions. The image presents the terms as 'natural' categories, obscuring their historical construction.
- Discipline & Subjectivation: By labelling these features, the image helps to discipline how we perceive and categorize the world. It contributes to the subjectivation of the viewer—shaping our understanding of ourselves as observers and categorizers of the landscape.
3. Critical Theory
A critical theory approach would focus on how this seemingly neutral educational tool reinforces particular ideologies and power relations.
- Ideology & Naturalization: The illustration presents a ‘naturalized’ view of geographical features. It implies that these landforms are inherent parts of the world, fixed and unchanging. It obscures the ways in which human activity (deforestation, dam building, urbanization, climate change) dramatically alters landscapes.
- Representation & Absence: The image’s focus on identifying landforms serves a functional purpose, but it also silences other important aspects of geography. There's no depiction of the human experience within these landscapes: no people, settlements, cultures, or historical narratives. This absence reinforces a detached, objective view of nature, separating it from human life and agency.
- Commodification & Control: Even seemingly innocent labeling can contribute to the commodification of land. Categorizing landforms allows for assessment, exploitation, and control (e.g., for resource extraction, development, or military purposes). The image subtly reinforces the idea that land is an object to be defined, categorized, and used.
4. Marxist Conflict Theory
A Marxist lens would see this map as potentially reinforcing existing class structures and inequalities related to land ownership and resource control.
- Means of Production & Land: Land is a primary means of production. This map identifies and categorizes landforms, implicitly contributing to their valuation and potential control by those with economic and political power. The classification of land allows for its allocation, ownership, and exploitation.
- Spatial Inequality: The map, while ostensibly neutral, may indirectly perpetuate spatial inequalities. By focusing on identifying landforms, it overlooks the ways in which access to land, resources, and environmental benefits are unequally distributed.
- Ideological Function: The map functions ideologically by presenting a seemingly objective understanding of land, obscuring the historical and ongoing conflicts over land ownership and resource control. It legitimizes existing power structures by presenting them as 'natural' parts of the landscape.
5. Postmodernism
A postmodern analysis would challenge the notion of a singular, authoritative representation of geography.
- Deconstruction of Categories: Postmodern thought would question the very categories presented. What defines a “plain” or a “jungle”? These are social constructs, not objective realities. There are infinite gradations and overlaps in the natural world, and rigid categorization is inherently artificial.
- Subjectivity & Perspective: Postmodernism emphasizes the subjectivity of knowledge. The map represents one possible way of seeing the landscape, but it is not the only valid perspective. Different cultures, communities, and individuals will have their own unique ways of understanding and relating to the land.
- Simulacra & Hyperreality: The illustration is a simulacrum – a copy without an original. It is a representation of a representation, further removed from 'reality.' The map can create a sense of hyperreality, where the representation becomes more compelling and influential than the actual landscape itself.
6. Queer Feminist Intersectional Analysis
While not the most obvious fit, a queer feminist intersectional analysis could examine how traditional geographical representations have historically excluded or marginalized marginalized communities.
- Spatial Exclusion: Traditional geographical knowledge has often been dominated by the perspectives of dominant groups (e.g., white, male explorers and scientists). This has led to the exclusion of indigenous knowledge systems, women’s experiences of space, and the spatial realities of LGBTQ+ communities.
- Mapping of Power: Mapping is not simply a neutral act of representation; it is a form of power. Maps can be used to enforce boundaries, control access to resources, and reinforce social hierarchies.
- Disruption of Normative Spatiality: A queer feminist analysis would challenge normative spatial arrangements and seek to create more inclusive and equitable spaces. This might involve challenging traditional notions of boundaries, ownership, and access to land.
I hope this detailed breakdown provides a multi-layered analysis of the seemingly simple illustrated map. Let me know if you would like me to delve deeper into any of these theoretical lenses!
simple-description (llama3.2-vision)
The meme is a humorous illustration of the Earth's geography, with various landforms and bodies of water labeled in a cartoonish style. The image is captioned "Here is a visual of every major geography term!" and lists numerous geographical features, such as mountains, oceans, and rivers, in a playful and exaggerated manner. The text at the top of the image sets the tone for a lighthearted and educational exploration of the Earth's geography.