First Seen
2023-09-02T23:47:21+00:00
simple-description (qwen3.5_2b-q8_0)
In the "Radio" category, the text identifies these as the longest waves on the chart, meaning they represent the lowest energy in this spectrum. The chart indicates that they are marked "Y" for penetrating the Earth's atmosphere and correspond to the coldest temperatures, $1\text{ K}$.
simple-description (llama3.2-vision_11b)
This meme is a humorous illustration that depicts the electromagnetic spectrum, a range of frequencies that include various forms of electromagnetic radiation, from low-frequency radio waves to high-frequency gamma rays. The meme is captioned "Radio" and features a cartoon character holding a radio, highlighting the radio frequency range of the electromagnetic spectrum. The text "Radio" appears in the image, emphasizing the focus on radio waves in this category.
detailed-analysis (gemma3-27b-vision)
Okay, let's break down this image of the electromagnetic spectrum through various theoretical lenses.
Visual Description
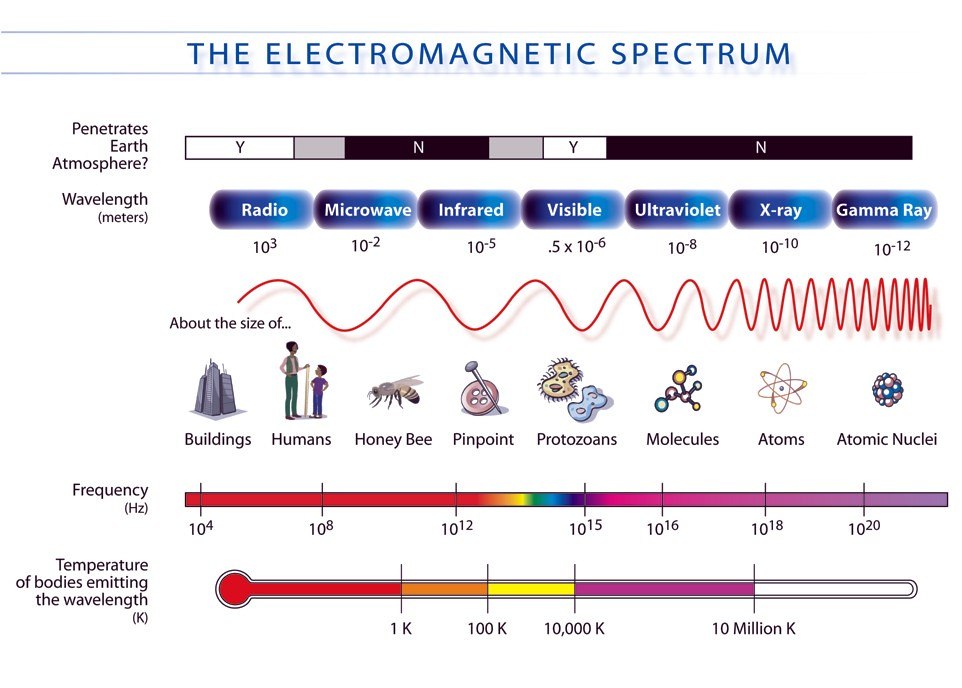
The image is a graphical representation of the electromagnetic spectrum, spanning from radio waves to gamma rays. It visually organizes the spectrum by wavelength (measured in meters), frequency (measured in Hertz), and approximate temperature (in Kelvin) of bodies emitting that wavelength.
The spectrum is horizontally laid out, starting with long wavelengths and low frequencies on the left (radio waves) to short wavelengths and high frequencies on the right (gamma rays). Each section (radio, microwave, infrared, visible, ultraviolet, X-ray, gamma) is color-coded, and illustrated with examples of objects/sizes related to that wavelength.
A key feature is the indication of atmospheric penetration (Y/N) above the spectrum, showing which wavelengths can reach the Earth's surface. At the bottom, a scale demonstrates the temperature of bodies emitting each wavelength, ranging from 1K to 10 million K. There is a visual correlation with size, indicating the scale of things related to those wavelengths, from buildings to atomic nuclei. The images are simplified representations to illustrate the relative scale of the wavelengths.
Foucauldian Genealogical Discourse Analysis
This image is a product of a particular discourse – the scientific discourse surrounding electromagnetism. A Foucauldian analysis would focus on how this image constructs and maintains knowledge about the electromagnetic spectrum, rather than simply representing an objective truth.
- Historical Contingency: This particular representation didn't just appear; it emerged through specific historical developments in physics. The concepts of wavelength, frequency, and temperature as fundamental properties were developed over time, through debates, experiments, and the accumulation of scientific knowledge.
- Power/Knowledge: The image is a tool of power/knowledge. It codifies complex scientific concepts into a visual format, allowing it to be easily disseminated and understood (or misunderstood). This dissemination reinforces the authority of the scientific discourse. Those who control the construction and dissemination of this knowledge (scientists, educators, institutions) wield power.
- Disciplinary Boundaries: The image reinforces the disciplinary boundaries within physics. It assumes a specific framework (electromagnetic theory) and defines the limits of what is considered "legitimate" knowledge within this field.
- Normalization: The image normalizes certain ways of understanding the electromagnetic spectrum. By presenting it as a linear, ordered progression, it obscures the complexities and uncertainties inherent in scientific inquiry. The depiction of "objects" corresponding to wavelengths is also a normalizing process, suggesting these wavelengths are fundamentally associated with these objects.
Critical Theory
From a critical theory perspective (drawing on thinkers like Adorno, Horkheimer, and Marcuse), this image could be seen as embodying the rationalizing tendencies of Enlightenment thought, potentially contributing to a "instrumental reason."
- Domination of Nature: By breaking down the electromagnetic spectrum into measurable, quantifiable units, the image reinforces a worldview that sees nature as something to be understood, controlled, and exploited. It reduces a complex phenomenon into discrete components, facilitating its manipulation for technological purposes.
- Technological Rationality: The graphic serves technological rationality. It represents the electromagnetic spectrum in a way that is easily accessible for engineering and technological applications.
- Reification: The image reifies the electromagnetic spectrum, presenting it as a fixed, objective entity, rather than a dynamic, fluid phenomenon. This reification obscures the social and historical contexts in which scientific knowledge is produced.
- Alienation: There is a degree of alienation through the abstraction of the phenomenon. The connection to lived experience is lost, replaced by mathematical representations.
Marxist Conflict Theory
A Marxist analysis would view this image through the lens of class struggle and the control of scientific knowledge for economic gain.
- Means of Production: The creation of this image (and the underlying scientific research) requires significant resources and infrastructure – laboratories, equipment, funding. These resources are typically controlled by capitalist institutions (universities, corporations, governments).
- Ideological Tool: The image serves as an ideological tool, reinforcing the legitimacy of the capitalist system. By presenting scientific knowledge as neutral and objective, it masks the power relations that shape its production and dissemination.
- Technological Advancement & Exploitation: The understanding of the electromagnetic spectrum has led to numerous technological advancements (radio, television, microwaves, etc.). These advancements have often been used to increase productivity, profit, and control over labor.
- Commodification of Knowledge: The knowledge embedded in this image can be patented, commercialized, and used for profit, contributing to the accumulation of capital by those who control it.
Postmodernism
A postmodern analysis (drawing on thinkers like Foucault, Lyotard, and Derrida) would challenge the notion of a singular, objective "electromagnetic spectrum."
- Deconstruction of Truth Claims: The image claims to represent an objective reality, but postmodernism would argue that all knowledge is constructed and relative. The choice of wavelengths, colors, and scales is not neutral, but reflects a particular perspective.
- Emphasis on Discourse: The image is a product of discourse – a system of language, ideas, and practices that shapes our understanding of the world. There are other ways to represent the electromagnetic spectrum, and each representation would have its own biases and limitations.
- Fragmentation & Multiplicity: Postmodernism emphasizes fragmentation and multiplicity. The image presents a linear, ordered spectrum, but reality is likely more complex and chaotic.
- Simulation & Hyperreality: The image is a simulation of the electromagnetic spectrum. It is not the spectrum itself, but a representation that shapes our perception of it. It can contribute to a hyperreality where the simulation becomes more "real" than the thing it represents.
Queer Feminist Intersectional Analysis
This analysis would examine how power dynamics related to gender, sexuality, race, and class intersect in the creation and interpretation of this image.
- Historical Exclusion: Historically, women and people of color have been excluded from scientific fields. This exclusion has shaped the questions asked, the methods used, and the interpretations made. The creators of this image (and the underlying research) likely belong to dominant groups.
- Representation & Bias: The image itself may reflect unconscious biases. For example, the choice of objects used to illustrate the wavelengths may perpetuate stereotypes or exclude certain groups.
- Power Relations in Knowledge Production: The scientific community is not neutral; it is structured by power relations. Those who hold positions of authority (e.g., professors, researchers, funding agencies) have a disproportionate influence on what is considered "legitimate" knowledge.
- Intersectionality: The experiences of scientists and engineers are shaped by the intersection of their multiple identities. A queer or transgender scientist, for example, may face unique challenges in a field that is often dominated by heterosexual, cisgender men.
- Reclaiming Space: A queer feminist analysis can also focus on reclaiming space for marginalized voices in science. By challenging dominant narratives and promoting inclusivity, it can help create a more equitable and just scientific community.
Important Note: These analyses are interpretations, and there can be multiple valid readings of this image depending on the theoretical framework used. Each lens reveals different aspects of the image and highlights the complex power dynamics that shape our understanding of the world.
simple-description (llama3.2-vision)
This meme is a humorous illustration that compares the electromagnetic spectrum, which is a range of frequencies of electromagnetic radiation, to the size of everyday objects. The meme shows a series of objects, including a building, a person, a bee, and an atom, each labeled with its corresponding size in meters. The text "1-1000km" appears at the top of the image, implying that the objects are being compared to a range of distances from 1-1000 kilometers.
The meme is likely referencing the fact that the electromagnetic spectrum is often visualized as a series of objects, with each object representing a different frequency of electromagnetic radiation.
tesseract-ocr
Penetrates eth Vo N Atmosphere? Waveleneth Pee Mee Gun eater Mme corm Centr.) 103 102 105 5x 10⁶ 108 10°10 10-12 ounce A, \ AVS VIVA Buildings Humans HoneyBee Pinpoint Protozoans Molecules © Atoms Atomic Nuclei Frequency (Hz) 104 108 1012 1015 1016 1018 1020 Temperature of bodies emitting the wavelength « 1K 100K 10,000 K 10 Million K