First Seen
2023-05-10T21:03:40+00:00
simple-description (llama3.2-vision_11b)
This meme is a humorous commentary on the societal norms of drinking culture, particularly in the UK. The image shows a graph with the title "The UK is the only country where drinking is a national pastime" and lists several countries with their respective drinking habits. The meme pokes fun at the UK's drinking culture, implying that it's a national obsession.
detailed-analysis (gemma3-27b-vision)
Okay, let's break down this data visualization through various theoretical lenses. Given the specific dataset (male drinking habits and adverse consequences in selected European countries), some lenses will be more productive than others.
Visual Description
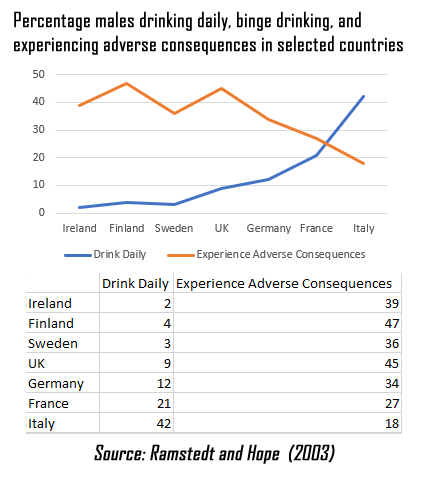
The chart is a line graph displaying the percentage of males in seven European countries (Ireland, Finland, Sweden, UK, Germany, France, and Italy) who report drinking daily and/or experiencing adverse consequences related to alcohol consumption.
- Two Lines: There are two distinct lines on the graph. The blue line represents the percentage of daily drinkers, while the orange line represents the percentage experiencing adverse consequences.
- Trends: The percentage of daily drinkers generally increases from Ireland to Italy, whereas the percentage of experiencing adverse consequences decreases from Finland to Italy.
- High and Low Points: Finland has the highest rate of adverse consequences (47%), while Ireland has the lowest (2%). Italy has the highest percentage of daily drinkers (42%), while Ireland has the lowest (2%).
- Correlation: There appears to be a positive correlation between daily drinking and the experience of adverse consequences, though not perfectly linear. Countries with higher rates of daily drinking tend to have higher rates of adverse consequences, and vice versa.
Foucauldian Genealogical Discourse Analysis
This chart can be analyzed through a Foucauldian lens by examining how discourses surrounding masculinity, alcohol, and public health produce these patterns.
- Discursive Formation: Alcohol consumption, particularly in certain cultures, is often deeply intertwined with constructions of masculinity. The chart hints at differing normative expectations for male alcohol use in these countries. What does it mean to be a man in Ireland versus Finland, in terms of drinking habits? The data suggests differing "regimes of truth" around alcohol consumption.
- Power/Knowledge: The very act of collecting this data—categorizing and quantifying "daily drinking" and "adverse consequences"—is an exercise of power/knowledge. It defines what is considered problematic behavior and creates a category for analysis. The statistics themselves produce a reality—they make certain trends visible, and obscure others.
- Genealogical Trace: Examining the historical development of alcohol consumption norms within each country could reveal how discourses of masculinity, national identity, and public health have shaped current patterns. For example, a history of strong brewing traditions in certain regions might influence current drinking habits.
- Normalization/Pathologization: The data points can be viewed in terms of what is considered "normal" or "deviant" drinking within each country. High rates of adverse consequences could trigger interventions aimed at "correcting" behavior, thus reinforcing certain norms.
Critical Theory
Using a Critical Theory lens, we can examine how broader social structures and ideologies contribute to these drinking patterns.
- Social Control: Alcohol, despite its harmful effects, is often legally sanctioned and commercially promoted. Critical theorists would question why this is, and who benefits from it. Does the normalization of alcohol consumption serve to maintain social control, perhaps by providing a temporary release of tension or a distraction from systemic problems?
- Alienation: The chart could be interpreted as reflecting a degree of alienation in modern society. Drinking might be seen as a coping mechanism for dealing with stress, isolation, or a lack of meaningful social connections.
- Ideology: Advertising and media play a crucial role in shaping perceptions of alcohol and masculinity. Critical theorists would analyze these representations to uncover underlying ideological messages that promote or normalize harmful drinking behaviors.
- Commodity Fetishism: Alcohol, as a commodity, can be divorced from its harmful effects and presented as a source of pleasure and social connection. This can obscure the underlying social and economic forces that contribute to problem drinking.
Marxist Conflict Theory
A Marxist analysis would focus on the role of class, economic structures, and power imbalances.
- Capitalist Profit: The alcohol industry is a major economic force. Marxists would argue that the promotion of alcohol is driven by the pursuit of profit, regardless of the social costs.
- Class Disparities: While this data specifically focuses on male drinking rates, it's possible that alcohol-related problems disproportionately affect working-class communities due to factors like limited access to healthcare and increased stress. (This data doesn't allow us to explore this directly, but it's a relevant consideration).
- Distraction from Exploitation: Alcohol consumption could be seen as a way to distract the working class from their exploitation and prevent them from challenging the status quo.
- Commodification of Social Life: The pub, for example, can be seen as a site where social life is commodified, and alcohol is used to facilitate social interaction.
Queer Feminist Intersectional Analysis
This is a more challenging lens to apply directly to this particular data. However, intersectionality emphasizes how various forms of oppression (gender, class, race, sexuality) intersect to create unique experiences.
- Gendered Norms: Alcohol consumption is often deeply embedded in patriarchal norms of masculinity. The chart can be seen as reflecting the pressure on men to conform to these norms, even at the expense of their health. (The data only focuses on male rates).
- Intersection with Class: Alcohol-related problems may be compounded by class inequality. Men from working-class backgrounds may face greater barriers to accessing support and treatment.
- Queer Challenges to Norms: Non-conforming gender expression, in combination with alcohol, can have a unique impact on individual experiences (again, the data doesn't allow for this exploration).
Important Note: While it's valuable to apply these lenses, it's crucial to avoid oversimplification. The chart provides limited information. A more comprehensive analysis would require additional data on social, economic, and cultural factors in each country.
simple-description (llama3.2-vision)
This meme appears to be a graph comparing the percentage of men who drink daily or experience adverse consequences from drinking in various countries. The graph shows that the UK has the highest percentage of men who drink daily, with 37%, while Sweden has the lowest, with 10%. The text "Drink Daily" and "Experience Adverse Consequences" are labels on the graph.
tesseract-ocr
Percentage males drinking daily, binge drinking, and experiencing adverse consequences in selected countries 50 40 30 20 10 ° Ireland Finland Sweden UK Germany France aly drink Daily ——Experience Adverse Consequences Drink Daily Experience Adverse Consequences Ireland 2 39 Finland 4 47 ‘sweden a 36 UK 9 45 Germany 2 34 France 2 27 Italy a2 18 Source: Ramstedt and Hope (2003)