First Seen
2023-08-30T01:50:30+00:00
simple-description (qwen3.5_2b-q8_0)
This visual joke is a classic "dog on a transit map," where the overlapping lines of the San Francisco Key System (specifically the Albion and Emeryville Railways) are drawn in a way that mimics a dog's head and snout. The humor arises from the fact that the functional map of public transportation is designed to look like an animal, specifically highlighting the converging lines in the Alameda area. The image text, "MAP OF THE KEY SYSTEM TRANSIT CO. APRIL 1926," serves as the context for this unexpected biological representation of a railway network.
simple-description (llama3.2-vision_11b)
The meme is a map of San Francisco's BART (Bay Area Rapid Transit) system, highlighting the "Transit" line that runs through the city's downtown area. The meme is poking fun at the idea that San Francisco's BART system is so extensive that it's even got its own line, implying that the city is so transit-focused that it's become a part of the city's identity. The meme is captioned "Transit" in a humorous, tongue-in-cheek way, implying that the city's BART system is so iconic that it's become a part of the city's culture.
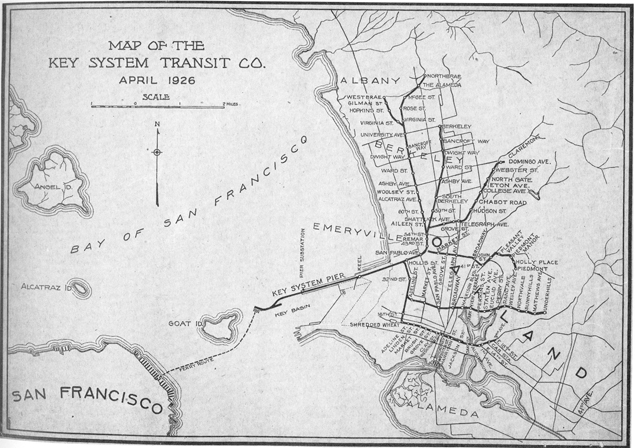
detailed-analysis (gemma3-27b-vision)
Okay, here's an analysis of the provided map of the Key System Transit Co. from April 1926, broken down into sections as requested. Not all categories are applicable, and I will note why if that's the case.
Visual Description
This is a black and white map depicting the Key System Transit Co.'s network in the San Francisco Bay Area. The map is fairly simple in design, appearing to be a hand-drawn or early printed diagram rather than a highly detailed cartographic representation.
- Geographic Area: It primarily focuses on the eastern side of San Francisco Bay, encompassing areas like Albany, Berkeley, Emeryville, Oakland, and Alameda, as well as parts of San Francisco itself (particularly the waterfront area near the Key System Pier). Alcatraz Island and Goat Island are also visible.
- Transportation Network: The primary feature is the network of transit lines. These are represented as solid and dashed lines, indicating the routes of the Key System. The lines show a system of rail lines branching out from a central terminus at the Key System Pier. The lines extend to various neighborhoods and cities around the Bay.
- Key Features: Labels identify streets, neighborhoods, and points of interest, such as specific avenues (e.g., College Ave, Alcatraz Ave), parks, and the Key System Pier. A scale is provided. A compass rose is included to indicate direction.
- Style: The overall style is utilitarian and functional. It prioritizes clarity of information about the transit system over aesthetic appeal. The use of solid and dashed lines and basic labels contribute to its practical purpose.
Foucauldian Genealogical Discourse Analysis
This map, as a document of power, can be examined through a Foucauldian lens. It’s not simply a neutral depiction of transportation, but a discourse that constructs and reinforces certain understandings of space, mobility, and social order.
- Power/Knowledge: The map produces knowledge about the region and its transportation networks, but this knowledge is inextricably linked to the power of the Key System Transit Co. The company controls the very terms by which this region is understood and navigated. The map creates a reality where the Key System is necessary for connection and movement.
- Disciplinary Practices: The map, though seemingly benign, subtly disciplines space and individuals. It defines acceptable routes and destinations. It implies that mobility is tied to the company’s infrastructure, shaping behaviors and habits. The lines of the map act as channels that steer the flow of people and goods.
- Genealogy of Control: Tracing the history of the Key System and its map (from its origins, through expansions, and eventual decline) reveals a genealogy of control over mobility. Understanding how the system evolved, the choices made in route planning, and the areas served/neglected reveals power dynamics at play. Did expansion happen based on capitalist interests? Did certain neighborhoods get left behind?
- Regulation & Normalization: The map normalizes certain modes of transport and travel patterns. The very act of depicting the Key System as the dominant mode of transport subtly discourages alternative forms of mobility.
Marxist Conflict Theory
This map offers a clear entry point for a Marxist analysis, focusing on the relationship between infrastructure, capital, and class.
- Means of Production: The Key System (the railway lines, the stations, the vehicles) represent a key “means of production” in this region. It facilitates the movement of labor, goods, and capital.
- Class Relations & Spatial Control: The map reveals how the Key System facilitates the exploitation of labor. Lines connecting industrial areas to residential zones allow workers to reach their jobs, while simultaneously allowing capitalists to access a labor pool. The map also demonstrates spatial control: who has access to mobility, and where can they go? Does the system prioritize access for the working class or for those who own the means of production?
- Uneven Development: Examining the map reveals potential patterns of uneven development. Where are the lines concentrated? Are certain areas underserved? This could indicate that certain neighborhoods or communities have been marginalized by the system, contributing to economic disparities.
- Commodity Fetishism: The map inadvertently contributes to "commodity fetishism" by presenting the transit system as a neutral service, obscuring the labor, resources, and power relations embedded within it.
Postmodernism
While the map’s aesthetic is decidedly pre-modernist, a postmodern reading can focus on its representation of reality and the challenges to grand narratives.
- Simulation & Hyperreality: The map isn't the territory itself, but a simulation of it. It’s a constructed representation that simplifies and abstracts reality. In a postmodern context, one could argue that the map contributes to a "hyperreality" where the simulation becomes more important than the reality it represents.
- Deconstruction of Space: The map doesn’t present a unified, coherent space. It’s fragmented into lines, stations, and neighborhoods. This fragmentation can be seen as a deconstruction of traditional notions of space and place.
- Subjectivity of Representation: The map is a subjective representation, created by the Key System Transit Co. It reflects the company’s interests and priorities. A postmodern analysis would challenge the idea that the map is an objective or neutral depiction of reality.
Queer Feminist Intersectional Analysis
This is the most challenging category to apply directly, but a nuanced reading can reveal underlying power dynamics.
- Spatial Politics & Access: The map implicitly shapes access to space. Were routes planned in ways that catered to or excluded certain groups? Consider the spatial segregation of the era – did the system reinforce existing patterns of gender and racial segregation?
- Intersectionality of Mobility: Access to mobility is not uniform. Factors like class, race, gender, and ability all intersect to shape who can move freely and to where. The map, by showing only the lines of the transit system, obscures the barriers that many people faced in accessing it.
- Public Space & Gendered Experiences: Consider how public spaces (stations, trains) were experienced differently by different genders. Were stations designed with safety and comfort in mind for all users? The map doesn’t reveal these subtleties, but prompts us to ask about them.
- Disrupting Linear Narratives: A queer feminist approach might question the linear and directional nature of the map. It challenges the idea that movement should always be purposeful and efficient, and instead celebrates alternative modes of travel and ways of being in space.
I hope this breakdown provides a comprehensive analysis of the map through these different theoretical lenses! Let me know if you'd like me to elaborate on any particular aspect.
simple-description (llama3.2-vision)
The image is a map of San Francisco, California, created by the Key System Transit Company in April 1926. The map shows the city's street layout, with the Bay of San Francisco to the west and the city's major landmarks and neighborhoods labeled. The map also includes a key to explain the symbols and abbreviations used on the map.
tesseract-ocr
S SS OX Zee wine Ve ee key system transit co, “GLC a Rae | Ge ct) a ES) " WANG. 4 Pin ee Vee E.. ¢ on \ =e ige> Ms me Fee ee jw alae (de i iA Cuiiey ye ie ea [SN NR PY FRANCIsc,® ed